Pipeline of GD & GBA-PD
SNCA ASO PK/PD Relationship In Transgenic Mice
Visible lead-in text:
In vitro
In vivo
Single ICV, 100 ug, A53T SNCA mice, -> 2w 후 분석: 1.2-1.9x better KD (vs IONIS)
- 3.5-7.4x better Exposure (vs Ionis)
[PK/PD]| tissue | parameter | WV-36397 | WV-37643 | WV-39172 | WV-42827 |
|---|---|---|---|---|---|
| Cortex | t1/2 (week) | 2.82 | 3.77 | >4 weeks* | >4 weeks* |
| Cortex | IC50** (ug/g) | 2.78 | 0.35 | 0.87 | 1.00 |
| Cortex | Imax | 0.78 | |||
| Cortex | Projected KD at 8 weeks at 100 ug/g | 21% | 68% | 54% | 61% |
| Striatum | t1/2 (week) | 3.67 | >4 weeks* | 3.80 | 7.86 |
| Striatum | IC50** (ug/g) | 0.67 | NE* | 0.22*** | 0.49 |
| Striatum | Imax | 0.62 | |||
| Striatum | Projected KD at 8 weeks at 100 ug/g | 26% | NE* | 62% | 56% |
Visible footnotes:
NE: not estimated due lack of enough data for model estimation
* No concentration change or slight concentration increase over 4 weeks
** PKPD relationship is based on direct PKPD relationship.
*** Indirect model estimate presented as a more conservative estimate as compared direct model estimate (0.05 ug/g)
* Projected based on direct response model except for WV-39172; if t1/2 not available for one matrix, assume t1/2 from the other; if t1/2 not available, assume t1/2 of 6 weeks and use concentration at 6 weeks for extrapolation

Takeda-Wave Collaboration Confidential
Takeda-Wave MAPT/SNCA JPT
April 29, 2021
44
Clinical Plan Of SNCA ASO
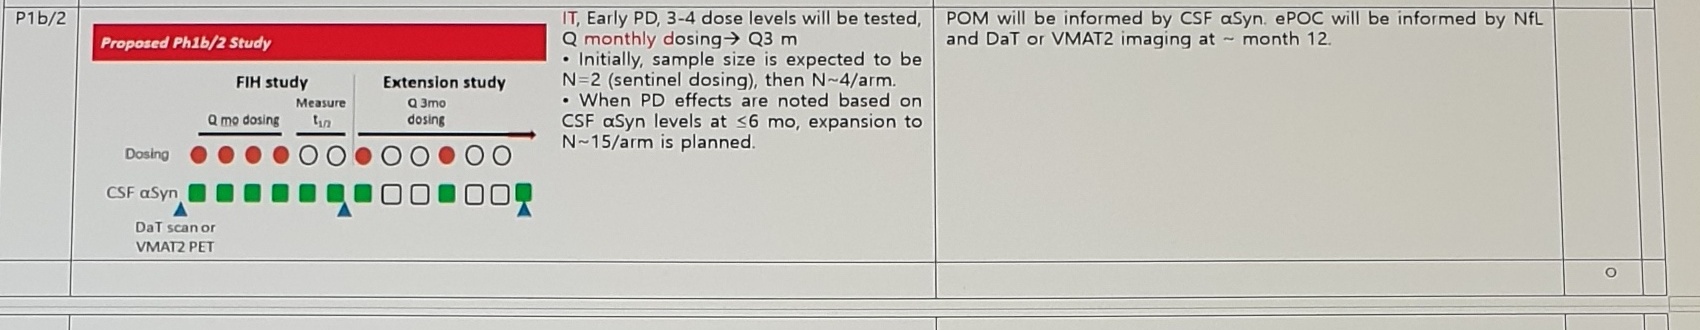
The first visible row is P1b/2. The design graphic and row evidence are preserved because the dosing / sampling schedule is easier to inspect visually than as text alone.
| phase | design | milestone | PK/PD |
|---|---|---|---|
P1b/2 | IT, Early PD, 3-4 dose levels will be tested, Q monthly dosing -> Q3 m; initially sample size expected to be N=2 sentinel dosing, then N~4/arm; when PD effects are noted based on CSF aSyn levels at <=6 mo, expansion to N~15/arm is planned. | POM will be informed by CSF aSyn. ePOC will be informed by NfL and DaT or VMAT2 imaging at ~ month 12. | visible but blank / no detailed text in this row |
Visible labels inside the proposed Ph1b/2 study diagram:
Proposed Ph1b/2 Study
FIH study
Extension study
Q mo dosing
Measure t1/2
Q 3mo dosing
Dosing
CSF aSyn
DaT scan or VMAT2 PET
PET SNCA ASO
SNCA ASO, HDO PET : a-syn ASO central biodistribution: Takeda Imaging is developing novel methods to radiolabel the a-syn ASO in order to be able to track its CNS biodistribution via PET imaging. If successful, this approach will enable the relative brain concentration of the ASO to be mapped throughout the brain, and hence to inform on parenchymal ASO exposure in the striatum relative to the cerebral cortex.

This imaging method will also provide a readout that can be used to optimize the injection paradigm to obtain the desired brain penetration and distribution. Studies using this approach with other ASOs have shown that the amount and distribution of IT-injected ASO in the brain can strongly depend on the injection paradigm - strategies such as synchronizing the injection to the cardiac cycle to capitalize on the pulsatile nature of CSF flow or the use of a saline chaser after the ASO injection have been reported to increase brain penetration.
SNCA ASO Questions
Target Population
PD (early vs late) vs MSA?Target aSyn KD Efficacy
- in PD patients and MSA patients? -> PD is priority. Don't have data in MSA.
- maximal KD from safety perspective -> not sure
- translation from MOUSE & NHP
- mRNA but effect on protein?
  - total, p-asyn, oligomeric -> staining not done
  - NDE?
PK/PD
- NHP spreading model will be used for human dose estimation a(and biomarker calibration?)? a Key go/no-go criteria? -> will be used
- A key question is the degree of a-syn reduction that is needed to advance the asset to Phase 2 studies. Studies are ongoing to validate a non-human primate model of a-syn spreading, with initial data expected by July 2020. If successful, this model can be used to test multiple doses of a a-syn ASO to determine which doses are effective in blocking a-syn spreading. In addition, this model will allow CSF a-syn levels to be related quantitatively to the degree of inhibition of spreading in disease relevant brain regions, which will allow target values for CSF a-syn reduction to be set objectively.
- Mouse spreading model ever tested? -> no
Administration
- IT, Frequency (3m, but TAU prefers ICV device, removal is easy)TAK-071 Clinical Plan
The lower part of the image begins the TAK-071 section. The leftmost heading is partly cut, but visible text indicates TAK-071, Executive summary, and Clinical plan.
| row / study | status | design | milestone | PK/PD | results |
|---|---|---|---|---|---|
1001 | single- and multiple-dose safety and tolerability in non-Japanese and Japanese healthy volunteers, and on evaluation of food effects | ||||
1002 | planned to evaluate the ability of TAK-071 to reverse cognitive impairment due to scopolamine but was terminated early because of a change in the indication strategy. | o | |||
K-1-02 OC study | ongoing | randomized, double-blind, placebo-controlled, 2-period, 2-treatment crossover study to evaluate the efficacy, safety, tolerability, PK, and pharmacodynamics of TAK-071 when administered orally QD in subjects with PD and evidence of cognitive impairment who are at risk for falls. | FPI: 30 Nov 2020 and LPLV: 27 Feb 2023; Total screened: 106; Number of Subjects Randomized: 54 |
Additional visible design text for K-1-02 OC study:
Approximately 64 male and female subjects with PD, aged 40 to <=65 years (with potential to expand to subjects up to age 85 after analysis of data from the sentinel cohort), inclusive, will be enrolled at up to 25 sites in the United States. The study will consist of a <=6-week screening period, two 6-week double-blind treatment periods separated by a >=3-week washout period, at-home assessments during the third week of each 6-week treatment period, and a safety follow-up call approximately 14 days after the last dose of study drug.

: PD diagnosis, H&Y >=2 and <4, age 40 to <=85, >=1 fall in the last 12 months, MoCA 11-26, can walk without aid for 2 minutes while doing serial 3 subtraction.

Primary: Change from baseline in gait variability during a 2-minute walk on a 10-meter walkway after 6-week treatment with TAK-071 compared with placebo.

Secondary: Change from baseline in a global cognition profile consisting of attention (SAT, SDMT), executive function (Cogstate Groton Maze Learning Test, Cogstate One Back Test), and memory (Cogstate International Shopping List Test, Cogstate One Card Learning Test) after 6-week treatment with TAK-071 compared with placebo.

Exploratory: Cued 180 turns, Timed Up and Go Test, Postural sway, In-home activity, Fall frequency, Near fall frequency, MDS-UPDRS, CGI-S/I, PGI-S/I, Speech, Epworth Sleepiness Scale.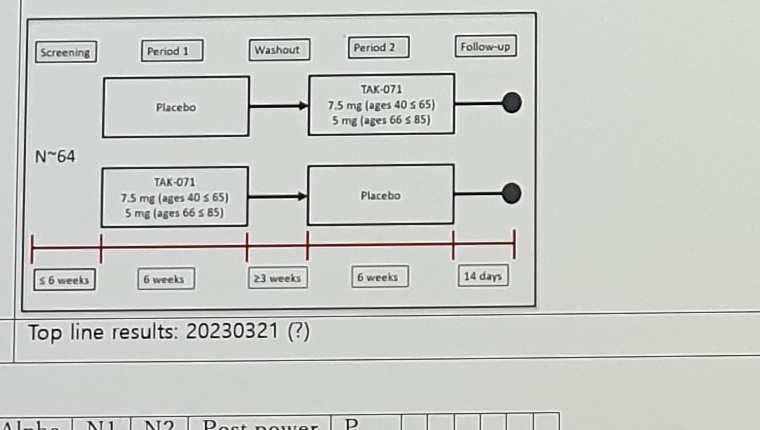
Visible labels in the TAK-071 crossover diagram:
Screening
Period 1
Washout
Period 2
Follow-up
N~64
Placebo -> TAK-071 7.5 mg (ages 40 <= 65), 5 mg (ages 66 <= 85)
TAK-071 7.5 mg (ages 40 <= 65), 5 mg (ages 66 <= 85) -> Placebo
<=6 weeks
6 weeks
>=3 weeks
6 weeks
14 days
Top line results: 20230321 (?)
TAK-071 Cognition Result Note
| field | value |
|---|---|
STV / d | visible row label d |
Cognition criteria for d | 0.49 |
Result for d | Js: Mean & sd 사용시 0.70; Js: LSM 사용시 0.556; Slide: 0.54 |
STV / P | visible row label P |
Cognition criteria for P | 0.8 |
Result for P | 0.62, P(effect size > 0.49) is 0.62 |
N | subjects with both periods: 36 |
Observed treatment difference | Mean(sd) = 0.285(0.526) |
TAK-071 Power Table Fragment
The power table at the bottom is clipped by the photo edge and likely continues beyond the visible frame.
| d | tail | Alpha | N1 | N2 | Post power | P |
|---|---|---|---|---|---|---|
0.54 | 1 | 0.1 | 45 | 38 | 0.88 | |
0.49 | 1 | 0.1 | 45 | 38 | 0.82 | |
0.49 | 1 | 0.05 | 45 | 38 | 0.71 | |
0.49 | 2 | 0.1 | 45 | 38 | 0.71 | |
0.49 | 2 | 0.05 | 45 | 38 | 0.59 | |
0.49 | ? | ? | 36 | 36 | ? | 0.62 |
0.54 | 1 | 0.1 | 36 | 36 | 0.84 | |
0.49 | 1 | 0.1 | 36 | 36 | 0.78 |
Uncertain Spans
| location | text/status | reason |
|---|---|---|
| navigation path | SNCA ASO (WAVE) > Clinical plan of SNCA ASO; related TAK-071 > Clinical plan | Inferred from body content and visible navigation headings; the active nav highlight is not crisp in the crop. |
| SNCA PK/PD table | Imax placement under WV columns | The Imax values appear centered/merged in the source table; values were transcribed as visible but column alignment should be checked against the image asset. |
| SNCA PK/PD footnotes | final projected-KD footnote marker | The left side of the footnote line is partly clipped/low contrast; wording is reconstructed from visible text plus OCR agreement. |
| SNCA ASO questions | a(and biomarker calibration?)? a Key go/no-go criteria? | The note is visible but looks like shorthand with duplicated a; preserved rather than normalized. |
| TAK-071 row label | K-1-02 OC study | Leftmost row label is partially cut by the photographed frame. |
| TAK-071 cognition result | Js: Mean & sd 사용시, Js: LSM 사용시 | Korean/English notation is preserved as seen, but meaning and exact abbreviation should be reviewed. |
| TAK-071 power table | highlighted row 0.49 / ? / ? / 36 / 36 / ? / 0.62 | Highlighted cells exist but several column entries are obscured or blank; the table continues beyond the visible bottom. |